What the General Ledger is
The General Ledger (GL) is the most detailed report in BitBooks. It shows every transaction, in every account, for whatever period you pick.
Where the P&L summarizes ("you had $45,000 in Sales this period"), the GL details ("here's every single transaction that contributed to that $45,000, with amounts, dates, contacts, and memos").
It's the report accountants run first when they want to understand what happened. It's also the report you run when something on the P&L looks wrong.
How to run it
- Click Reports in the left sidebar
- Click General Ledger tab
- Pick a date range
- The report renders
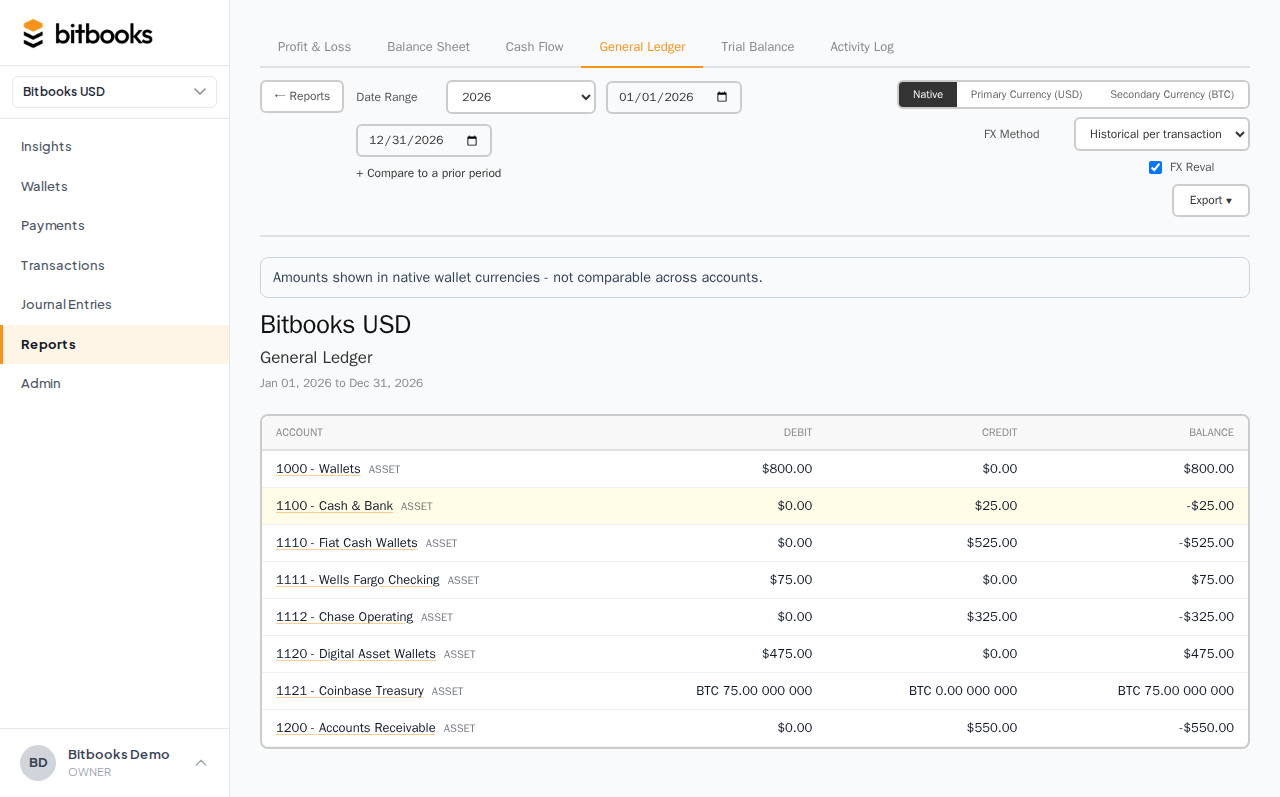
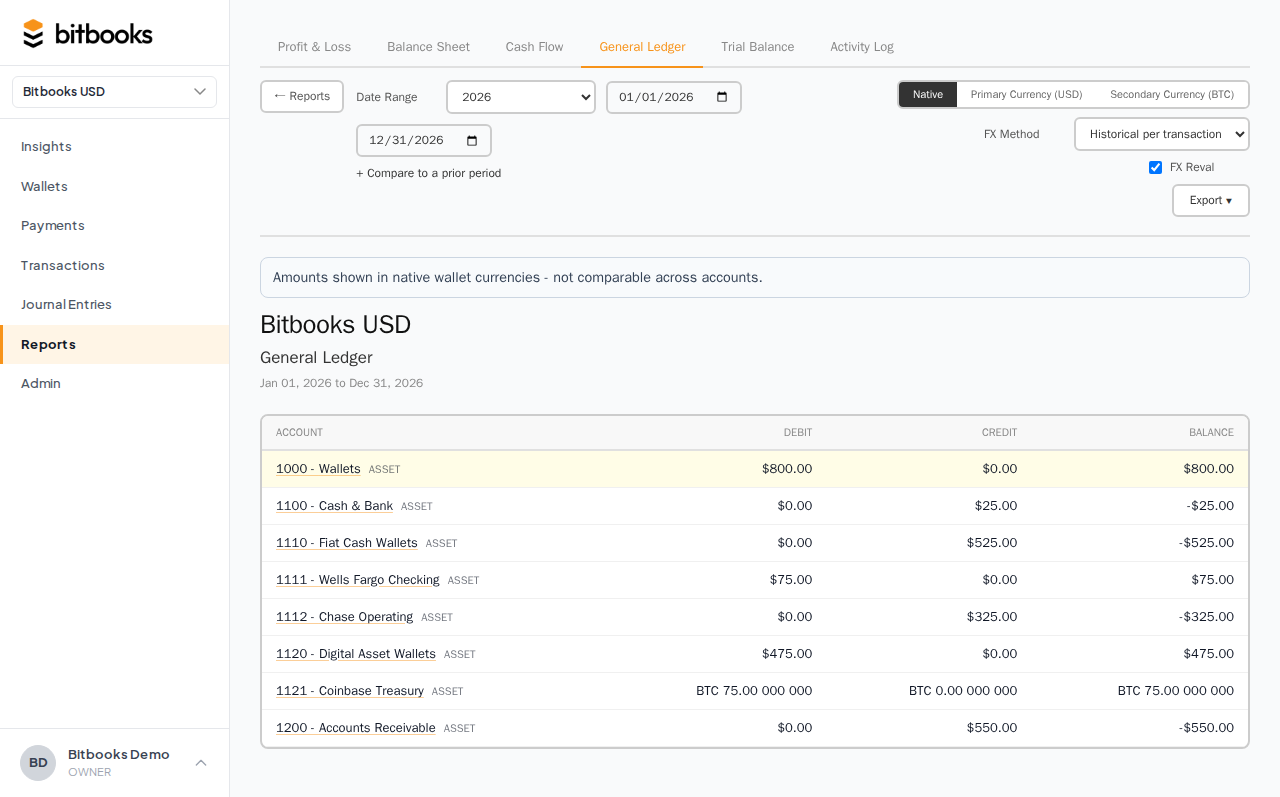
What the report shows
The GL is organized by account. For each account that had activity in the period:
- Account name and code (e.g., 4010 Sales)
- Beginning balance (what was in this account at the start of the period)
- Every transaction in the account during the period: date, contact, memo, debit amount, credit amount, running balance
- Ending balance (what's in the account at the end of the period)
Like this:
4010 SALES
  Beginning balance:                                                       $0.00
  ─────────────────────────────────────────────────────────────────────────────
  Date        Memo                       Contact          Debit    Credit  Balance
  ─────────────────────────────────────────────────────────────────────────────
  2026-01-03  morning sale               Cash Customer            $25.00   $25.00
  2026-01-03  Lightning sale 5k sats     Cash Customer            $40.00   $65.00
  2026-01-04  refund                     Cash Customer    $5.00            $60.00
  ...
  ─────────────────────────────────────────────────────────────────────────────
  Ending balance:                                                          $45,000.00
Run for a year and you might have 1,000 lines. The GL doesn't care.
Filtering and drilling
The GL supports filters at the top:
- Date range. Period to display.
- Account. Show one specific account, or all.
- Contact. Show only transactions involving a specific contact.
- Direction. Money in only, money out only, or both.
The most common use is filtering to a single account when you want to investigate it.
The "Detail" mode
When you click on a single account from the main GL view, the page switches to GL Detail. This is the deep-dive: only one account, full transaction list, with all the metadata visible.
Useful when:
- You're investigating a single number (P&L said $9,000 in Salaries, you want to see what 9,000 came from)
- An auditor wants account-level detail
- You're reconciling at the account level
The GL Detail view supports the same filters: date range, contact, direction.
Drilling from another report
Most reports support drill-down to the GL:
- Click a number on the P&L → opens the GL Detail for that account
- Click a wallet balance on the Insights page → opens the wallet's transaction history (basically GL Detail for the wallet's account)
- Click a row on the Trial Balance → opens GL Detail for that account
The GL is the "back end" the other reports build on. Anywhere you see a summary number, you can drill into the GL detail.
What's NOT in the GL
- Drafts. Excluded from all reports. Only Posted, Approved, and Reversed entries.
- Off-book information. Memos, attachments, audit log entries are linked but not shown directly.
- Future-dated entries beyond the report's end date.
For a full audit including draft activity and metadata, use the Activity Log report instead.
Multi-currency in the GL
If your organization uses multiple currencies, the GL shows transactions in their functional currency by default. Each line displays the functional value (USD, CAD, etc.).
To see the original transactional currency, click into the line. The detail shows transactional amount, currency, exchange rate, and the calculated functional value.
If you have a reporting currency set, you can toggle the GL to display in reporting currency. The numbers translate using the report's end-date rate.
Export
Click Export at the top of the GL to download as PDF or Excel.
PDF: read-only, suitable for handing to an accountant.
Excel: editable, suitable for further analysis. Each transaction is a row with separate columns for date, account, debit, credit, contact, memo. Easy to filter, pivot, sum.
For a full year's GL, the Excel export can be 10,000+ rows. Excel handles that fine. It'll be a few-second download.
A worked example
Your P&L for March shows $9,500 in "Software Subscriptions" expense. You don't remember spending that much. You want to see what's in there.
- Click on the $9,500 number on the P&L. The page navigates to GL Detail for Software Subscriptions, March.
- You see the list:
- $200 Slack
- $400 GitHub Team
- $1,500 AWS hosting
- $7,400 (highlighted in red because it's unusually large), payment to "Adobe" memo "annual subscription"
- You investigate the $7,400. It's an annual Adobe Creative Cloud renewal. Yes, that's real.
The P&L number was right; you just needed the GL Detail to see what made it up.
GL vs Trial Balance vs Activity Log
| Report | Purpose |
|---|---|
| General Ledger | Every transaction, organized by account |
| Trial Balance | Account ending balances (debit and credit columns), plus the math check that they're equal |
| Activity Log | Every action ever taken, organized by user/entity, including reversals and edits |
You'd use:
- GL to investigate specific numbers
- Trial Balance as a quick health check
- Activity Log to see who changed what and when
They draw from the same underlying data; they organize it differently.
Common questions
"Can I save filters as a saved view?"
Not in the current UI. Each time you load the GL, set the filters fresh. Saved views are on the roadmap.
"How far back can I run the GL?"
As far back as your organization's data goes. If you've been in BitBooks for 3 years, you can run the GL across all 3 years. Performance scales: a 3-year GL with 50,000 transactions might take 10-20 seconds to render.
"Why is my account's beginning balance different from the prior month's ending balance?"
It shouldn't be. If they differ, run the Trial Balance to check internal consistency. If Trial Balance is fine but GL beginning ≠ prior ending, contact support; that's a bug.
Where to go next
- Profit & Loss Report for revenue and expense summaries
- Balance Sheet for asset/liability/equity balances
- Trial Balance for the books-health-check
- Activity Log for who-did-what-when
- Exporting Reports to PDF and Excel for getting reports off the screen