What KPIs are showing you
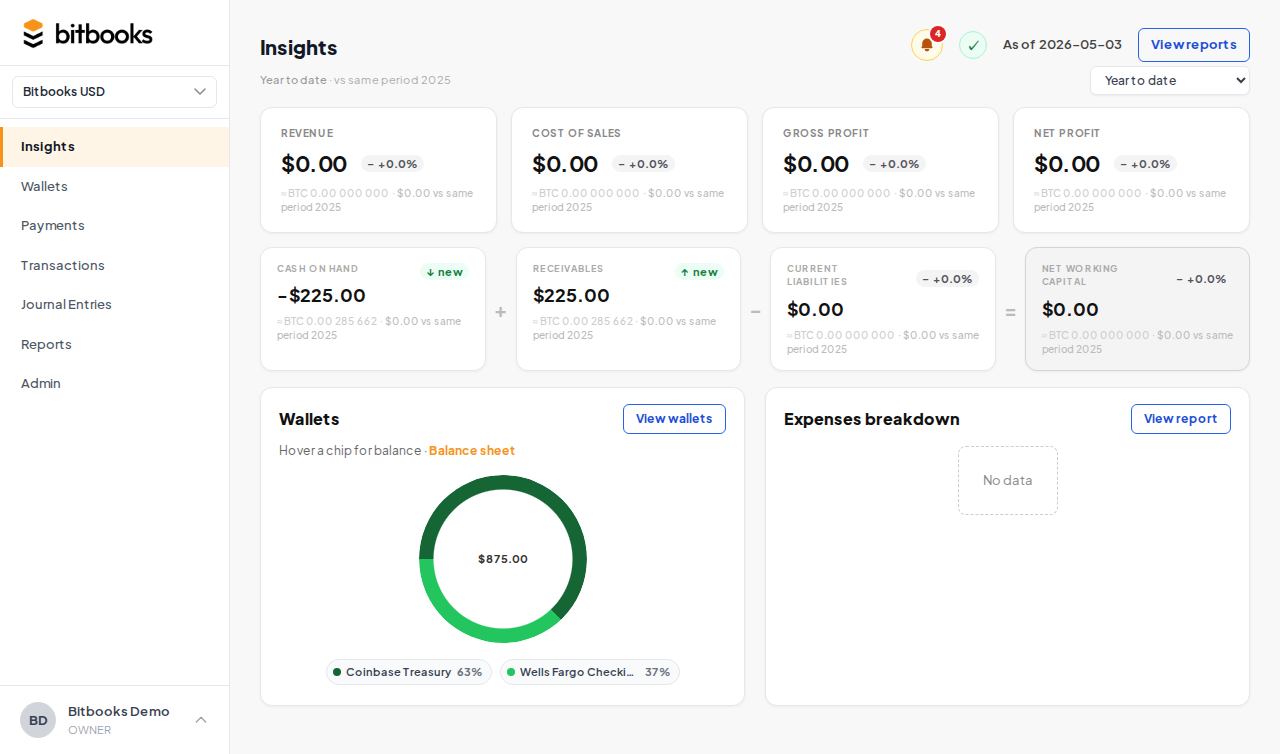
The top of the Insights page shows four numbers (KPIs):
- Revenue. Total income for the period.
- Cost of Sales. What it cost to produce what you sold.
- Gross Profit. Revenue minus Cost of Sales.
- Net Profit. What's left after all operating expenses.
Each KPI shows:
- The current period number (large)
- The prior period number (smaller, for comparison)
- A trend chip: green up arrow (improving), red down arrow (declining), grey dash (flat)
- A "vs" label showing what the comparison is
How prior period is chosen
The prior period depends on what you have selected:
| Current period | Prior period |
|---|---|
| Year to date | Same period last year |
| Last month | The month before |
| Last quarter | The quarter before |
| Last year | Two years ago |
| Custom range | The same length range immediately before |
For example, if you set custom Jan 15 to Feb 15, the prior is Dec 14 to Jan 14 (same 32 days, ending the day before the current period starts).
This is the standard way of comparing. It answers "are we doing better or worse than the same period before?"
Reading the trend chip
- Green arrow up = current period is better than prior. For revenue and profit, "better" means bigger. For expenses, "better" means smaller (less spending is better).
- Red arrow down = current is worse than prior. The opposite logic.
- Grey dash = essentially flat (less than ~1% change either way).
The chip color is based on the metric's direction-of-good. Revenue going up is green. Expenses going up is red. The system flips the meaning automatically so you don't have to think about it.
When prior period numbers feel wrong
A few cases where the prior period number can surprise you:
"Year to date" early in the year
If it's January 8 and you switch to "Year to Date," you're comparing 8 days of this year to all of last year. That's apples to oranges. Switch to "Last Year" or a custom range that matches what you actually want to compare.
Brand new business
If you started in October and you're looking at "Last Year" in March, the prior period was before the business existed. You'll see your full revenue this year vs $0 last year. The trend chip will say +infinity. Not useful information; just acknowledge the comparison isn't meaningful yet.
Period spans a major event
If your prior period included a one-time event (a big sale, a big expense, a fundraising round), the comparison will look weird in the period after. That's just the nature of comparison; it doesn't mean the books are wrong.
The period selector
A dropdown at the top of the Insights page lets you change the period.
Options:
- Year to date (default)
- Last month
- Last quarter
- Last year
- A specific year (one entry per year you have data for)
- Custom period (pick any start and end date)
When you change the period, all four KPIs recalculate, and the working capital row, wallet snapshot, and expense breakdown update too.
The period selector affects only the Insights page. The Reports page has its own date picker.
What's NOT included in KPIs
A few things that don't show up here:
- Drafts. Excluded from all reports including KPIs. Only Posted entries count.
- Future-dated transactions. If you're looking at "Year to Date" and it's March, transactions dated in April don't count even if you've already posted them.
- Closed-period changes. If you reopen and edit a closed period, the changes do count in the recalculation. Reopening is rare.
Where the numbers come from
KPIs are calculated server-side from the underlying journal entries. The same logic that produces the P&L produces the KPIs, so they always agree:
- Revenue KPI = Total Income on the P&L
- Cost of Sales KPI = Total Cost of Sales on the P&L
- Gross Profit = Revenue minus Cost of Sales
- Net Profit = bottom line of P&L
If a KPI looks wrong, run the P&L for the same period. They should match. If they don't, that's a bug worth reporting to support.
Multi-currency note
The KPIs display in your functional currency (your organization's main currency).
If your organization has a secondary reporting currency set, you can toggle between functional and reporting display. The numbers don't change, just the currency they're shown in.
Where to go next
- Understanding Your Insights Page for the full dashboard
- Profit & Loss Report for the deeper view of revenue and expenses
- Notifications, Ledger Health, Activity Log for the other dashboard widgets
- The Three-Currency Model for the currency display logic