What a P&L is
The Profit & Loss report (also called Income Statement) answers one question:
Did the business make or lose money during this period?
It does that by showing income on one side, expenses on the other, and the difference between them at the bottom. If income is bigger, you have a profit. If expenses are bigger, you have a loss.
Every business runs a P&L. Monthly, quarterly, annually. It's the single most-shared financial report.
How to run it in BitBooks
- Click Reports in the left sidebar
- Click Profit & Loss (it's the default report)
- Pick a date range (default: year to date)
The report renders immediately.
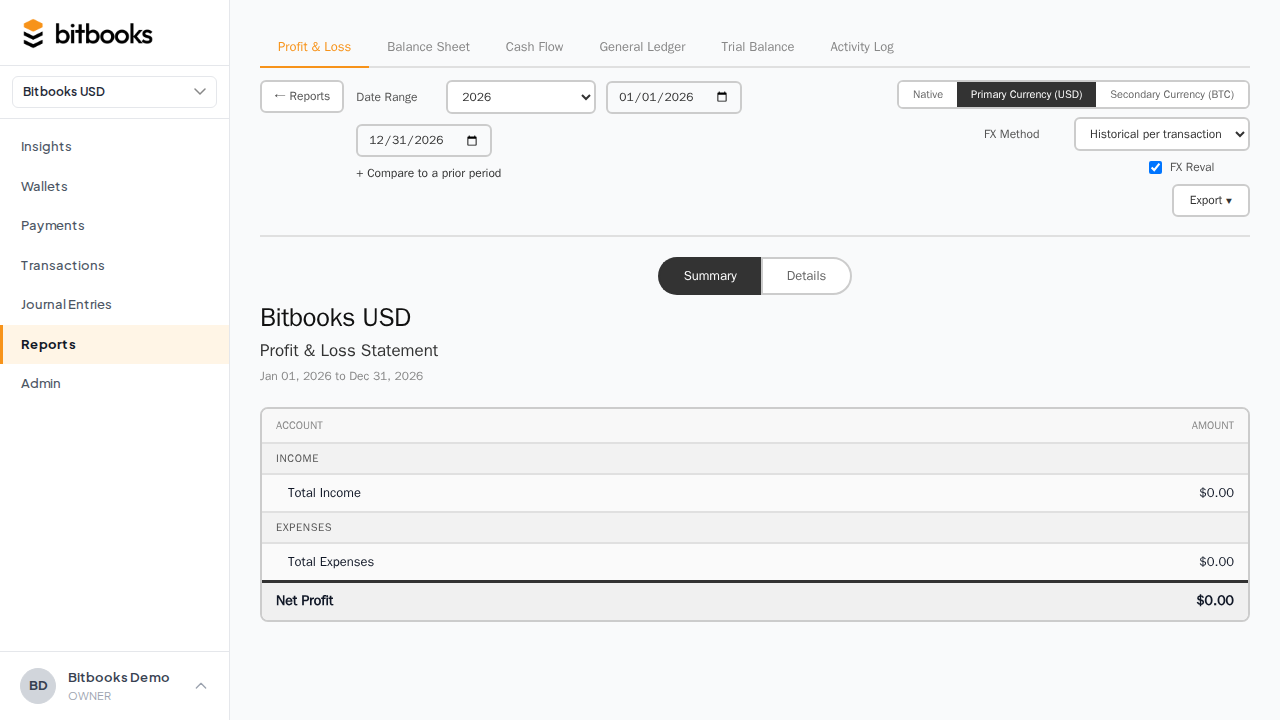
What the report shows
A typical P&L is structured like this:
INCOME
  Sales                                $45,000.00
  Other Income                          $1,200.00
  ─────────────────────────────────────────────────
  Total Income                         $46,200.00

COST OF SALES
  Cost of Goods Sold                   $18,000.00
  ─────────────────────────────────────────────────
  Total Cost of Sales                  $18,000.00

GROSS PROFIT                           $28,200.00

OPERATING EXPENSES
  Salaries                              $9,000.00
  Rent                                  $3,600.00
  Software Subscriptions                $1,200.00
  Marketing                               $850.00
  General & Administrative                $720.00
  ─────────────────────────────────────────────────
  Total Operating Expenses             $15,370.00

NET PROFIT                             $12,830.00
Three layers of "profit" appear:
- Total Income. All the money you brought in.
- Gross Profit. Income minus cost of sales (the direct cost of producing what you sold).
- Net Profit. Gross profit minus operating expenses (rent, salaries, marketing, etc.). The bottom line.
What goes where
The category an account ends up in is determined by its account type and subtype, set when the account was created in your Chart of Accounts.
| What it is | Account type | Where it lands |
|---|---|---|
| Money customers paid you for products/services | INCOME / SALES | Income |
| Money from sources other than your main business | INCOME / OTHER_INCOME | Other Income |
| Direct cost of producing what you sold | EXPENSE / COST_OF_SALES | Cost of Sales |
| Salaries | EXPENSE / LABOR | Operating Expenses |
| Marketing | EXPENSE / SALES_AND_MARKETING | Operating Expenses |
| Rent, utilities, software | EXPENSE / GENERAL_AND_ADMINISTRATIVE | Operating Expenses |
| One-off expenses outside the normal categories | EXPENSE / OTHER_EXPENSES | Operating Expenses |
To change where an account appears, go to Admin → Chart of Accounts, find the account, and update its sub-type.
The date range matters a lot
A P&L for January looks very different from a P&L for the year. Pick the period that answers your specific question:
- Last month: how did we do this past month?
- Year to date: how are we doing for the year so far?
- Last quarter: investor or board review
- Last full year: annual reporting, tax filings
- Custom range: any specific window (e.g., for a project that ran March 15 to May 22)
The default in BitBooks is year to date.
Comparing periods (this year vs last year)
A single P&L is informative. A comparative P&L is more informative because it shows whether you're improving or declining.
To compare:
- On the P&L page, find the Compare dropdown
- Pick a comparison period (e.g., "Same period last year")
- The report rerenders with two columns: current period and prior period, plus a "change" column showing the difference
This is the standard format investors and bankers expect. Same numbers, in context.
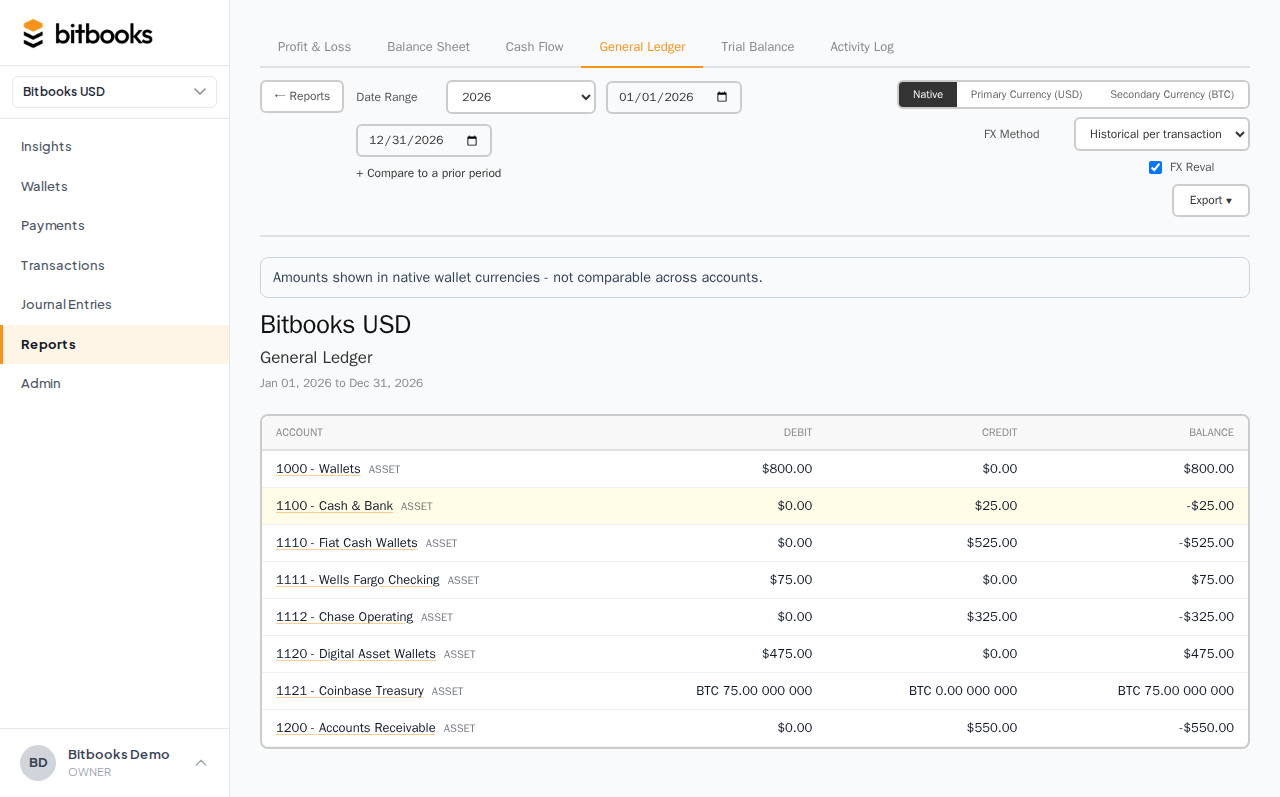
Drilling into a number
Any number on the P&L is clickable. Click it to see the underlying transactions.
For example, click on "Salaries: $9,000.00" and you'll see every transaction posted to the Salaries account during the period: each payment, the date, the contact, the amount. This is sometimes called the "audit trail" or "drill-down."
If a P&L number looks wrong, drill into it. The wrong number traces back to a wrong transaction, which you can then fix.
Multi-currency P&L
If your organization has a secondary reporting currency set, the P&L can be displayed in either the functional currency or the reporting currency. Toggle between them at the top of the report.
The numbers don't change, just the currency. A profit of CAD$12,830 might display as USD$9,407 in the reporting view (depending on the exchange rate).
See The Three-Currency Model Explained for the deeper concept.
Exporting
Click Export at the top of the P&L to download as PDF or Excel.
- PDF. Suitable for sharing with investors, banks, board members. Looks like a printed report.
- Excel. Suitable for analysis, putting numbers in a model, or attaching to a tax return.
What the P&L does NOT show
- The cash you have in the bank. That's the Balance Sheet.
- Money customers owe you. That's also the Balance Sheet (Accounts Receivable).
- The full detail of every transaction. That's the General Ledger.
- Draft entries. Drafts are excluded from all reports.
- Bitcoin holdings' unrealized value changes. Those appear on the P&L only after you run an FX revaluation. See Tracking Bitcoin Value Changes.
A common mistake: looking at a healthy P&L profit and assuming you have cash to spend. The P&L tells you whether you earned a profit. The Balance Sheet tells you whether you have cash. They're not the same. You can be profitable on paper while still being short on cash if customers haven't paid their invoices yet.
Run both reports together to get the full picture.
Common questions
"My profit on the P&L doesn't match the change in my bank balance. Why?"
Profit is based on accrual accounting (revenue is recognized when earned, expenses when incurred). Bank balance is just cash. The two diverge when you sell on credit (revenue recorded, no cash yet), buy on credit (expense recorded, no cash yet), or hold inventory.
"How do I see only one customer's revenue?"
The P&L is by account, not by contact. To see revenue per customer, run the General Ledger and filter by contact, or run a custom Sales by Customer report (Reports → Sales by Customer when available).
"Why is my net profit different from net profit minus tax?"
The P&L shows pre-tax profit. Tax expense is recorded separately (often as a year-end journal entry). For after-tax profit, look at the P&L for the full year after closing, including tax provisions.
Where to go next
- Balance Sheet to see what you own and owe at a point in time
- General Ledger for the full transaction-level detail
- Trial Balance to verify the books are internally consistent
- Comparative Reports for year-over-year analysis
- Exporting Reports to PDF and Excel